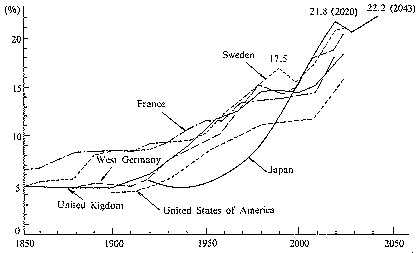
| Chart I. Trend of the Ratio of the Aged (65 years and over) to the Total Population |
 |
| Source: For Japan, from Statistics Bureau, Prime Minister's Office and Population Problems Research Institute of Ministry of Health and Welfare For other countries, from UN __In 1950, the number of those aged 65 and over was 4,155,000 only 4.9% of the total population. That is, during the 31 years since 1950, the number of those of 65 and over had increased 2.6 times, and the ratio of the aged to the total population had increased rapidly. This tendency is expected to continue, and it is estimated that at the beginning of the 21st century, the total number of those aged 65 and over will exceed 20,000,000, and account for more than 15% of the total population. |
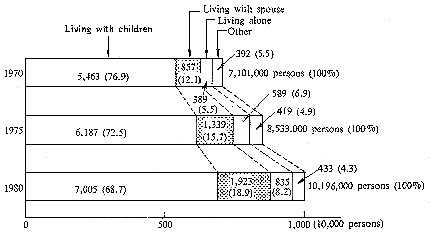
| Chart II. Living Pattern of Persons 65 Years and Over |
 |
| Source: Statistics Bureau, Prime Minister's Office Note: Both actual number and proportion are those of ordinary households, not including quasi-households. |
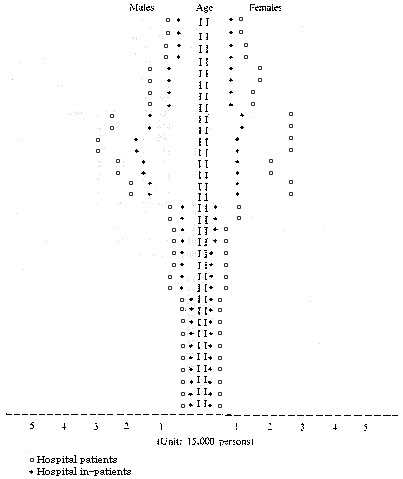
| Chart III. Estimated number of hospital patients and in-patients by age and sex per day in 1980 |
 |
| Source: Ogawa, N., Population in Japan: Aging of the Population, NPRI Reprint Series, No. 13, Population Research Institute, Nihon Univ., Tokyo (1984), p. 16. |
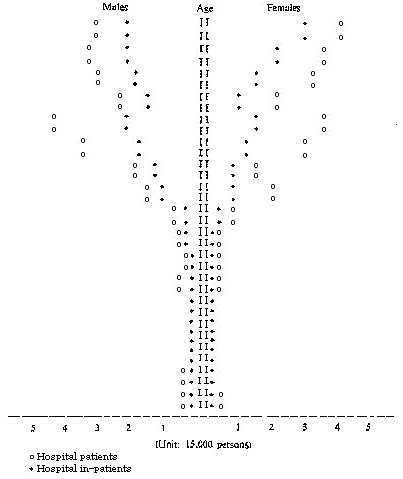
| Chart IV. Estimated number of hospital patients and in-patients by age and sex per day in 2025 |
 |
| Source: Ogawa, N., Population in Japan: Aging of the Population, NPRI Reprint Series, No. 13, Population Research Institute, Nihon Univ., Tokyo (1984), p. 17. |
| Table 1. Population-future population projected-percentage distribution by three broad age groups and sex, 1920-2075 Both sexes | |||||||||||||||||||||||||||||||||||||||||||||||||||||||||||||||||||||||||||||||||||||||||||||||||||||||||||||||||||||||||||||||||||||||||||||||||||||||||||||||||||||||||||||||||||||||||||||||||||||||||||||||||||||||||||||||||||||||||||||||||||||||||||||
| |||||||||||||||||||||||||||||||||||||||||||||||||||||||||||||||||||||||||||||||||||||||||||||||||||||||||||||||||||||||||||||||||||||||||||||||||||||||||||||||||||||||||||||||||||||||||||||||||||||||||||||||||||||||||||||||||||||||||||||||||||||||||||||
|
Note; * Population census 1920-1980 _____* Excluding Okinawa-ken for 1947-1970 Sources: "Population estimates of Japan" ______"1970 Population census of Japan" ______"1975 Population census of Japan" ______"1980 Population census of Japan" ______Statistics Bureau, Prime Minister's Office. ______Institute of Population Problems, MHW ______"Future population projected for Japan by sex and age for 1980-2080 Prepared in November 1981" | |||||||||||||||||||||||||||||||||||||||||||||||||||||||||||||||||||||||||||||||||||||||||||||||||||||||||||||||||||||||||||||||||||||||||||||||||||||||||||||||||||||||||||||||||||||||||||||||||||||||||||||||||||||||||||||||||||||||||||||||||||||||||||||
| Table 2. Future changes in selected social security-related indicators, 1980-2025 | |||||
| Year | Social security benefit (billion yen) | Social security benefit National income (per cent) | Tax revenue National income (per cent) | Social security contribution National income (per cent) | Social security contribution + Tax revenue National income (per cent) |
| 1980 | 23 842 | 12.46 | 21.89 | 9.45 | 31.35 |
| 1985 | 40 288 | 14.09 | 23.02 | 10.89 | 33.92 |
| 1990 | 68 814 | 16.31 | 23.79 | 12.64 | 36.44 |
| 1995 | 121 273 | 20.00 | 24.00 | 15.48 | 39.49 |
| 2000 | 214 038 | 24.73 | 23.56 | 18.88 | 42.45 |
| 2005 | 373 273 | 30.23 | 23.92 | 22.20 | 46.12 |
| 2010 | 660 470 | 36.31 | 23.42 | 28.17 | 51.60 |
| 2015 | 1 122 703 | 43.21 | 23.19 | 34.62 | 57.81 |
| 2020 | 1 558 375 | 46.99 | 23.31 | 38.21 | 61.53 |
| 2025 | 1 970 066 | 48.70 | 23.36 | 39.94 | 63.30 |
| Source: Ogawa, N., Population in Japan: Ageing of the Population, NPRI Reprint Series, No. 13, Population Research Institute, Nihon Univ., Tokyo (1984), p. 15. | |||||
| Table 3. Changes in medical services required per day, 1980-2025 | |||||
| Year | Number of hospitals | Number of hospital beds | Number of clinics | Number of clinic beds | Number of dentists |
| 1980 | 8 599 | 1 260 648 | 74 112 | 279 897 | 35 674 |
| 1985 | 9 297 | 1 385 868 | 78 469 | 307 332 | 36 738 |
| 1990 | 10 058 | 1 520 508 | 83 280 | 339 635 | 37 524 |
| 1995 | 10 919 | 1 667 589 | 89 544 | 376 426 | 38 302 |
| 2000 | 11 725 | 1 809 365 | 96 159 | 414 119 | 38 928 |
| 2005 | 12 350 | 1 929 240 | 101 366 | 447 054 | 39 266 |
| 2010 | 12 716 | 2 011 731 | 104 055 | 468 822 | 38 903 |
| 2015 | 12 956 | 2 072 469 | 105 505 | 487 398 | 37 953 |
| 2020 | 13 132 | 2 118 254 | 106 704 | 508 031 | 37 049 |
| 2025 | 13 061 | 2 120 696 | 106 399 | 513 912 | 36 265 |
| Source: Ogawa, N., Population in Japan: Ageing of the Population, NPRI Reprint Series, No. 13, Population Research Institute, Nihon Univ., Tokyo (1984), p. 15. | |||||